 The Independent Uganda: You get the Truth we Pay the Price


See how bad Kampala air is compared to other cities around the world in new report
Kampala, Uganda | THE INDEPENDENT | Air pollution is now considered to be the world’s largest environmental health threat, accounting for seven million deaths around the world every year. Air pollution causes and aggravates many diseases, ranging from asthma to cancer, lung illnesses and heart disease. The estimated daily economic cost of air pollution has been figured at $8 billion, or 3 to 4% of the gross world product.
Air pollution affects those that are most vulnerable the most. It is estimated that in 2021, the deaths of 40,000 children under the age of five were directly linked to PM2.5 air pollution. And in this age of COVID-19, researchers have found that exposure to PM2.5 increases both the risk of contracting the virus and of suffering more severe symptoms when infected, including death.
In September 2021, the World Health Organisation (WHO) released a timely and ambitious update to its global air quality guidelines, 15 years after the last update released in 2006. Acknowledging the significant impact of air pollution on global health, the WHO cut the recommended annual PM2.5 concentration by half, from 10 µg/m³ down to 5 µg/m³, with the ultimate goal of preventing millions of deaths.
Unfortunately, there are very few places in the world where you can breathe air clean enough to meet standards set by the WHO, according to a new report.
The report by IQAir focused on a type of air pollution called PM2.5 — which is smaller than 2.5 micrometers in diameter. This is also known as fine particulate matter. It’s associated with a wide range of heart and lung disorders as well as an increased risk of certain cancers.
PM2.5 is generated from many sources and can vary in chemical composition and physical characteristics. Common chemical constituents of PM2.5 include sulfates, nitrates, black carbon, and ammonium. The most common human-made sources include internal combustion engines, power generation, industrial processes, agricultural processes, construction, and residential wood and coal burning. The most common natural sources for PM2.5 are dust storms, sandstorms, and wildfires.
While many other air quality reports and apps report air quality information based on satellite data, this report is generated exclusively from PM2.5 measurements obtained by ground-level monitoring stations.
The data from individual stations were combined into “settlements,” which can represent a city, town, village, county, or municipality depending on local population patterns and administrative structures. The data from cities are subsequently population weighted and aggregated to create a regional annual average and ranking.
Scientists examined pollution data from air monitoring stations in 6,475 cities and 117 countries, regions, and territories to see how many places had average PM2.5 levels in 2021 that fell below 5 micrograms per cubic meter (mcg/m3) — the air quality standard set that year by the World Health Organisation (WHO).
Not one country measured up to this standard. And just 222 cities — about 3.4 percent — made the grade.
“It is a shocking fact that no major city or country is providing safe and healthy air to their citizens according to the latest World Health Organisation air quality guidelines,” said Frank Hammes, the chief executive officer of IQAir, in a statement.
“This report underscores just how much work remains to be done to ensure that everyone has safe, clean, and healthy air to breathe,” Hammes said. “The time for action is now.”
 Places that meet WHO Standards
Three territories did meet the WHO air quality standards for PM2.5: the French territory of New Caledonia and the United States territories of Puerto Rico and the U.S. Virgin Islands.
But most of the findings were bleak.
Scientists found 93 cities with average annual PM2.5 concentrations that were more than 10 times higher than the WHO standards.
Central and South Asia had 46 of the world’s 50 most polluted cities, the report found. Just two cities in these regions — Zhezqazghan and Chu in Kazakhstan — met WHO air quality standards.
In Africa, only one of 65 cities examined met the WHO air quality standards. The picture was similarly dire in Asia, where only four of 1,887 cities in the analysis met WHO standards. And it was only slightly better in Europe, where 55 of 1,588 cities achieved this.
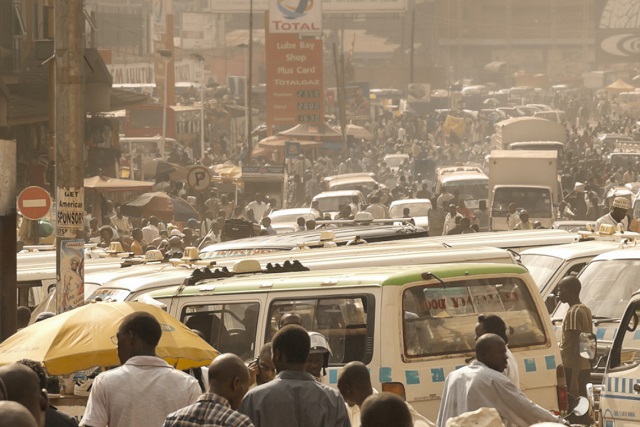
Uganda Air Quality: Not a Pretty Picture
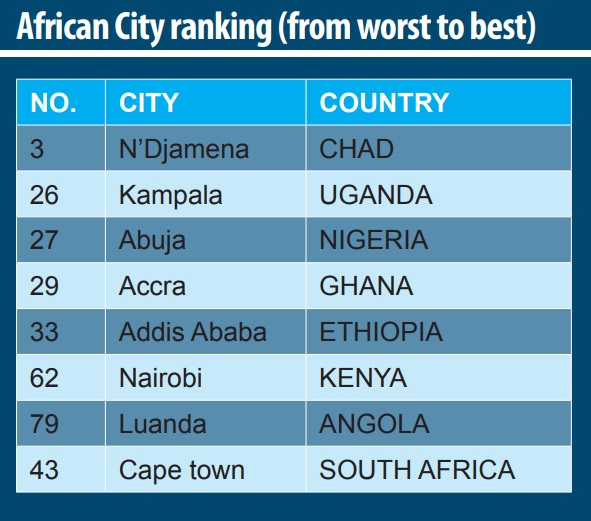
Kampala was among cities with the worst air pollution in Africa. In 2021 the city’s PM2.5 annual average was 27.6 mcg/m3 . That placed at 563 out of the 6,475 cities surveyed. That means it was among the 9% cities with the worst air pollution in the world. The only silver lining is that the city’s air quality has, in fact, improved. The 2021 pollution was lower than in previous years. In 2017 it was 54.3 mcg/m3 and 40.8 mcg/m3 in 2018.
Regionally, the air pollution in the Kenyan capital Nairobi averaged 14.3 mcg/m3 in 2021 down from 14.7 mcg/m3 in 2020. The Ethiopian capital Addis Ababa averaged 23.9 mcg/m3 up from 14.7 mcg/m3.
Cities with the worst air pollution on the continent were in west and South Africa. N’Djamena, the capital of Chad averaged 77.6 mcg/m3 making it the 29th most polluted city in the world. Port Harcourt in Nigeria averaged 51.6 mcg/m3, but Abuja was at par with Kampala at 27.3 mcg/m3.
Familiar cities such as Dubai averaged 36.9 mcg/m3, New Cairo 29.1 mcg/m3, and Durban 16.3 mcg/m3. Globally, the five most polluted countries in 2021 were Bangladesh, Chad, Pakistan, Tajikistan, and India.
Air quality also got worse in the United States, the report found. Average PM2.5 levels in 2,408 American cities climbed from 9.6 mcg/m3 in 2020 to 10.3 mcg/m3 in 2021.
In the United States, Atlanta and Minneapolis saw significant increases in pollution. Los Angeles was the worst offender, even though its average levels of PM2.5 actually decreased 6 percent from 2020 to 2021. The West Coast overall had the highest PM 2.5 concentrations in the country.
 The worst offenders globally
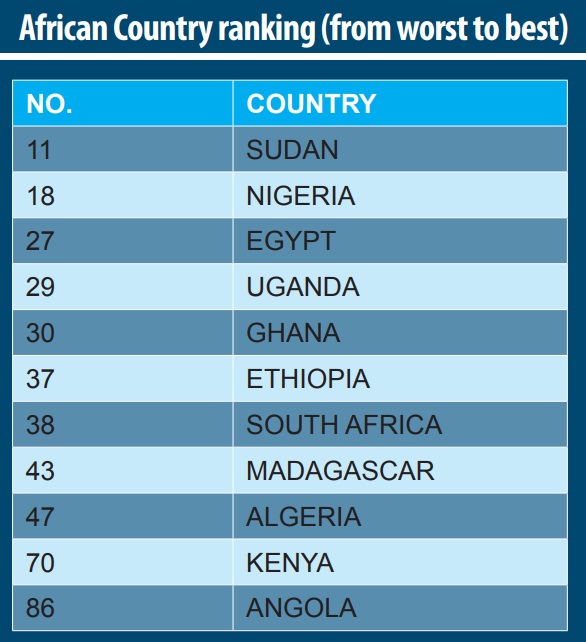
Globally, the five most polluted countries in 2021 were Bangladesh, Chad, Pakistan, Tajikistan, and India. These nations had air pollution levels at least 10 times higher than the WHO standards. Notably, the African continent had only 13 out of 54 countries with sufficient public air quality monitoring data, resulting in a majority of countries remaining unsurveyed.
India also had the most polluted capital city, New Delhi, for the fourth straight year, followed by the capital of cities in Bangladesh, Chad, Tajikistan, and Oman.
China offered some good news. More than half of the Chinese cities in the report reduced their air pollution from 2020 to 2021. And pollution levels within the capital city of Beijing improved for the fifth consecutive year, driven by emission control and reduced activity in coal-fired power plants and other high-emission industries.
IQAir’s annual World Air Quality Report aggregates and compares millions of PM2.5 measurements taken in thousands of locations around the world. The data is gathered over the course of the year from a combination of regulatory and non-regulatory ground-based air quality monitors. Although many areas around the world still lack access to publicly available air quality information, global air quality data continued to increase in 2021.
While the 2020 World Air Quality Report included data from 4,745 locations in 106 countries and regions, the 2021 report coverage expanded to 6,475 locations in 117 countries, territories, and regions. This is in part due to the increasing number of low-cost air quality sensors mostly operated by non-profit organizations, governments, and citizen scientists. The increased number of PM2.5 stations helps to create a more accurate picture of hyper-local air quality, and global air quality.
****